3. Demographics The questionnaire was administered in both urban, rural and peri - urban communities (less dense populations located at the fringes of urban settlements with productive land). Animators administrated the questionnaire in the areas in each core district that had received greatest outreach deployment. Whilst the data ther efore captures responses across urban, rural and peri - urban communities a relatively larger number of respondents were interviewed from urban and peri - urban communities 3 . Disaggregation by type of locality varied by District. In Western Area Urban 89% of responses was collected in the Urban Community; unsurprisingly, considering that it includes the capital of Sierra Leone. Bombali, Kenema and Kono covered a greater mix of communities although the majority were urban based. Kono District recorded the highe st percentage of respondents in a rural setting, at 27%. Bo District differed by having a majority peri - urban (67%) respondents and 17% urban. The PNB enumerators were not given specific quotas, but asked to collect responses in a variety of communities. The CSO enumerators were asked to aim for a 50/50 gender distribution plus equal age distributions. Gender balance was achieved across age groups; age distribution closely reflected PNB data collated on the reporting platform. PWD were also interviewed, although not proportionately. 3 The 2015 Population and Housing Census showed that 41% of the Sierra Leonean population lives in Urban area (page 30) https://www.statistics.sl/images/StatisticsSL/Documents/final - results_ - 2015_population_and_housing_census.pdf Chart 2: Type of Communities by district
6. Bo District has indicated the most positive response to a change in behaviour by education providers. 25% of respondents have indicated a cessation in payment requests; 34% report reduced frequency; 26% that less money is requested. These are positive ch anges. Only 1% of Bo respondents perceive negative change. Western Area and Kenema indicate the least change with 44% of respondents in Western Area stating that no change has occurred, 39% in Kenema. Western Area also recorded the least positive change a gainst the country average: 17% of respondents report a cessation of requests for payment/bribes; 16% report reduced frequency; and 12% less money. These figures are significantly less than the PNB averages highlighted in Chart 8, above. 7% of Western Are a respondents also indicate an increase in frequency as well the amount requested. Sierra Leone Police Respondents perceived less positive change and increased negative behaviour among police officials compared to other sector providers. 42% of respondents indicate no change in behaviour and 9% a negative change. 6% indicate a cessation in bribe demands; 33% greater secrecy by the police in requesting payment/bribes. Perceived changes among Education officials Chart 8: Perceived changes in education providers’ behaviour Chart 9: Perceived changes in police officials’ behaviour
8. At PNB core district level, emphasis has been placed on MDA transparency and accountability. MDAs engage monthly with ACC Regional Managers and CSO partners in planned Regional Technical Working Group meetings. These are attended by the MDAs, CSO partner, ACC and a district council representative. The meeting explores and comments on actions taken /planned by each MDA. Monthly Accountability Forums also take place, attended by the public, ACC, CSO partner and the 5 MDAs. The aim of the Forum is to ensure MDA transparency to the public on what they are doing to respond to citizen reports of petty co rruption. The data suggest that the model is more effective in the provinces than in Freetown. While the ACC and CSOs in the districts engage with District Medical Officers, District Education Officers and Local Unit Commanders of the SLP, the ACC and Co ffey in Freetown tends to engage more on a programme level with the MDA Headquarters. Hence the engagement in the Freetown is to an extent more “distant” from the service providers on the ground, may be a factor reducing the impact in the Western Area. Furthermore, data for the 3 MDAs suggests that respondents perceive more positive behaviour change among Health and Education providers than among the Police. Paradoxically, during the PNB campaign SLP at national level has been the most actively engaged; producing some of the strongest responses to PNB data. Conversely, at national level the Ministry of Education has to date limited its engagement with PNB, reflected in low or no responses to PNB monthly reporting data. The higher level of perceived positi ve behaviour change by Education providers, as opposed to the SLP, suggests a disconnect between national MDA involvement and public perceptions of positive change at district level. During a recent PNB Learning and Sharing Workshop attended by the ACC and CSO partners, one of the CSOs made a presentation on challenges faced by the PNB Campaign that suggested that corruption in the police force is vertically systemic. Police officers had anonymously informed the CSO of SLP cartels: s ystems of downward pressure from superiors to share revenue gains from petty corruption. While this was not corroborated, it could provide one explanation of the negative responses to SLP arising from the progress assessment. If bribery is more vertically systemic within SLP, then PNB engagement will almost certainly yield fewer gains. Alternatively, if petty corruption by other MDA providers and officials is for self - gain alone then that individual may be more receptive to PNB input on behaviour change. Resistance to bribery Across the 3 sectors, 77% of respondents state they are more likely to say NO to paying a bribe to a public official than one year ago; Education was highest with 82% of respondents and SLP lowest with 72% of respondents. Differenc es may be due to the nature of the services. CSO enumerators reported that some respondents find it difficult to resist paying bribes, especially to the police and health providers, in the belief that it could have severe consequences. Table 5: Are you m ore likely to say NO to pay a bribe now than one year ago? Health Police Education Yes 1816 1701 1930 No 528 619 424 Blank 15 39 5 Total 2359 2359 2359 Significant variation between districts is not evident, although questionnaire data from Western Area suggests slightly less willingness amongst the public to resist bribery. This corresponds to other questionnaire data on behavioural change by public offi cials indicating consistent low scoring in Western Area.
5. totalling more than 100%. The percentage calculation of both the p erceived change (blue and red bars) and the No change is based on the total number of responses made by individual respondents. Health 69% of respondents have experienced behaviour change among health providers recently, while 31% had not. The most common ly perceived change is that service providers are now more secretive when requesting a bribe (31%) and that bribes being requested less often (29%). Both statistics suggest increased awareness levels amongst health providers of the illegality and the risk of exposure in engaging in petty corruption. 17% of respondents report that health providers have ceased asking for bribes entirely; just 4% state that health providers now request higher payments/bribes or request them more frequently than previously. Kono District reported the most positive change; 23% of respondents report that health providers have stopped asking for payment/bribes; 32% reporting that providers requested payment/bribes less often. 22% do not perceive any change; 4% report negative change. Respondents in Western Area and Kenema perceive the least change in health provider behaviour; 39% and 37% respectively stating “No change”. Of those Kenema respondents r eporting behaviour change, it is primarily that health providers are now more secretive with asking for payment/bribes (41%). In Western Area the figure is lower at 23%. By comparison, 23% of respondents in Western Area report that health providers have stopped asking for bribes, compared to 10% of respondents in Kenema. Education Respondent perceptions of behaviour change among education providers mirrors that of health providers in that 30% do not identify any change. The data highlights greater secr ecy by education providers when requesting payment/bribes (25%) in addition to less frequent demands (28%). 20% of respondents report that providers have ceased requesting payment/bribes; a higher percentage than for both health providers and the Sierra Le one Police. Chart 7: Perceived changes in health service providers’ behaviour
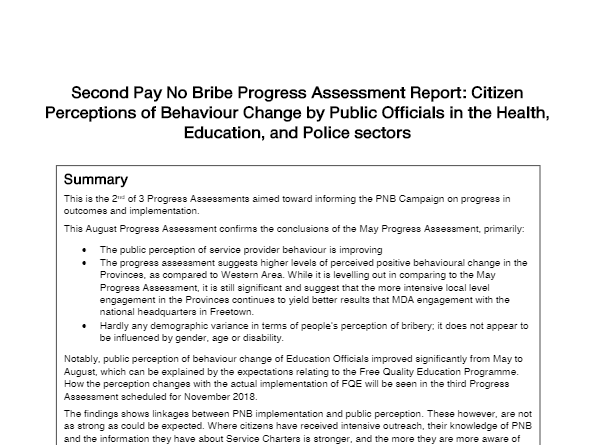
1. Pay No Bribe Progress Assessment Report: Citizen Perceptions of Behaviour Change by Public Officials in the Health, Education, and Police sectors Background The Anti - Corruption Commission of Sierra Leone and Coffey International is, with funding support from UK Aid, implementing the Pay No Bribe Campaign. The Campaign started in September 2016 with the launch of the Pay No Bribe reporting platform. The Pay No Bribe platform is a reporting mechanism for citizens to anonymously report incidents of petty corruption and bribery through a free hotline phone number, mobile apps or the PNB website ( www.pnb.gov.sl 2 ). The platform collects data on br ibery and corruption in key service sectors, currently Education, Electricity, Health, Police, Water and the Justice sector. It provides a database on petty corruption and bribery trends to support the work of the ACC and MDAs to eliminate corrupt practice . A key PNB strategy has been sustained communication and outreach work in the 5 core districts of Kenema, Kono, Bo, Bombali and Western Area. This is undertaken both by ACC public education officers and 123 CSO animators. In addition, public information o n petty corruption issues is distributed through IEC and regular radio programming across the country. Purpose The primary purpose of the Progress Assessment was to assess whether the public has experienced a change in the behaviour of public officials wi th respect to petty corruption; whether citizens are now more likely to resist corruption; and whether the public thinks that the ACC is now more likely to act against corruption compared to one year ago. The progress assessment presents a snap shot allow ing the Pay No Bribe campaign to assess progress in these key perception areas and re - strategize if required. 3 Progress Assessments are planned during 2018. Methodology The first progress assessment was undertaken on 15/16 May 2018 across all 5 core dist ricts - Bo, Bombali, Kenema, Kono, Western Area (Urban and Rural). The questionnaire was administered by PNB CSO animators using Kobo Collect. 15 CSO Animators in each of the 5 core districts were selected and received a one day training on administering the questionnaire using the Kobo Collect tool on their smart phones – a total of 75 animators. Each animator was requested to collect 15 responses per day over a 2 day period, leading to a total of 2250 completed questionnaire interviews: 15 animator x 15 r esponses x 2 days x 5 Districts = 2250 responses The actual number of responses however, as Table 1 illustrates, was marginally higher than planned in all Districts. This is probably due to animators inadvertently collecting more responses than planned. The actual number of responses was 2359. 1 The PNB website is scheduled to integrate with the Anti - Corrupti on Commission website ( www.anticorruption.gov.sl ) and will cease to exist as an individual website.
11. Conclusions Although data is not directly comparable, the Progress Assessment suggests a public perception of improved practise by Health, Education and SLP service providers/officials, and only 4% perceived an increase in corruption for education and health and 9% fo r SLP. Data from 2017 End of Pilot and New baseline Survey indicated that 69% of respondents thought that corruption had “ increased a lot ”; 12% that it had “ Decreased a lot ”. The progress assessment suggest higher levels of perceived positive behavioural change in the Provinces, as compared to Western Area. This may be due to more intensive local level engagement in the Provinces than in the Western Area, where the engagement of the PNB Campaign is more focussed on programmatic and policy issues with the n ational headquarters of the MDA, than on the district level authorities. Furthermore, the perceived positive behavioural change appears to larger degree to derive from local initiatives and individuals changing behaviour due to increased sensitization a nd awareness, and to a lesser degree from centrally orchestrated administrative action and systemic reforms. Finally, it is remarkable that the data does not highlight demographic variance of significance; people’s perception of bribery does not appear to be influenced by gender, age or disability.
4. 16% of respondents were recorded as having a disability, a figure significantly higher than the official statistic of 1.3% for Sierra Leone 4 . This discrepancy was due to the CSO Animators being asked to include persons with disability in the data collection, without a quota being stated. Kono recorded a higher percentage of PWD; 23.4% of respondents having a disability. Little demographic variance was noted between districts; neither in “type of Community”, gender or age. Perceived behavioural change among Public Service Delivery Officials Respondents were asked whether they had noted behaviour change among public service delivery providers within the Health, Education and Police sectors. If they had perceived a change, they were asked to identify what kind of change, and offered a multiple choice listing with the opportunity to select more than one option. Hence, in the following charts perceived changes (blue and red bars) and the No change should be seen as separate figures 4 “ Sierra Leone 2015 Population and Housing Census - Thematic Report on DISABILITY” https://sierraleone.unfpa.org/sites/default/files/pub - pdf/Disability%20Report.pdf page 11) Chart 3: Gender distribution Chart 4: Age distribution Chart 5: Respondents with disabilities Chart 6: PWD in districts
9. The data highlights a lesser willingness in Kenema District to resist SLP bribery. Over the duration of the PNB programme residents of Kenema District have reported police corruption in relatively large numbers. Public perceptions from the questionnaire data however suggest that the challenges persist. Respondents demographics do not indicate significant variance by age, gender and disability to bribery resistance, other than a slight tendency among the over 50s to say NO to bribery. Table 6: Demograph ics and increased likelihood of saying NO to bribery for Health service Total Gender Age Disability Female Male Under 29 Years 30 - 49 Year Above 50 years old No Yes No 22% 23% 22% 25% 22% 19% 23% 19% Yes 77% 76% 78% 74% 78% 80% 76% 80% (blank) 1% 1% 1% 1% 0% 1% 1% 1% Grand Total 100% 100% 100% 100% 100% 100% 100% 100% Table 7: Demographics and increased likelihood of saying NO to bribery for Education Total Gender Age Disability Female Male Under 29 Years 30 - 49 Year Above 50 years old No Yes No 18% 19% 17% 20% 18% 15% 18% 16% Yes 82% 81% 83% 80% 82% 85% 81% 84% (blank) 0% 0% 0% 0% 0% 0% 0% 0% Grand Total 100% 100% 100% 100% 100% 100% 100% 100% Chart 11: Chart 12: Chart 10:
2. Table 1: Number of Responses collected per District Bo Bombali Kenema Kono Western Area Rural Western Area Urban Grand Total Planned Number of Responses 450 450 450 450 450 2250 Actual number of Responses 458 482 467 478 89 385 2359 In terms of sampling, the animators were instructed to administrate the questionnai re to every fifth person they m et, and if that person was not interested to go to the next. No quotas were provided, but the animators were instructed to aim towards an equal gender distribution, a spread among age groups and to remember to collect responses from people with disabilities. During questionnaire administration on 15 th and 16 th May , staff from ACC, Coffey and the CSOs monitored the process to ensure consistency in data collection. ACC staff and CSO coordinator monitoring the data collection Pay No Bribe billboard in Kenema town Disclaimer: The main purpose of the Pay No Bribe Progress Assessme nt is to assess progress in key perception areas and re - strategize if required. The Pay No Bribe Progress Assessme nt was not carried out by an independent third party, but by implementing partner and does not claim scientific rigor. The main objective of the progress assessment was internal consumption, however the PNB programme would like to make it available for the general public for transparency.
7. Bo and Kenema has seen the most positive change. 27% of Bo respondents state that police are demanding payment/bribes less often with 23% that they are asked for less money. The figures for Kenema are 34% and 19% respectively. In Western Area, a greater percentage of resp ondents report no behaviour change by the police (49%). 8% reported a cessation to bribe demands, 13% a reduction in frequency and 7% a reduction in the sum requested. 12% of respondents in Western Area indicate an increase in frequency as well as amount requested by police officers, a considerably higher figure than the 9% average across PNB districts. (see Chart 9 above). General Respondent demographics (gender, age, PWDs, Community type) do not indicate significant difference in the perception of beha viour change. Irrespective of age, gender and disability the percentage of respondents reporting “ no change ” to petty corruption is consistent: 29 - 34% for Health; 27% - 32% for Education; and 39% - 45% for Police. Table 2: Demographics and perceived behavioural change among health officials Total Gender Age Disability Female Male Under 29 Years 30 - 49 Year Above 50 years old No Yes No 31% 29% 34% 33% 29% 34% 32% 30% Yes 69% 71% 66% 67% 71% 66% 68% 70% Grand Total 100% 100% 100% 100% 100% 100% 100% 100% Table 3: Demographics and perceived behavioural change among education officials Total Gender Age Disability Female Male Under 29 Years 30 - 49 Year Above 50 years old No Yes No 30% 30% 30% 27% 31% 32% 30% 27% Yes 70% 70% 69% 72% 69% 67% 70% 72% (blank) 0% 0% 1% 0% 0% 1% 0% 1% Grand Total 100% 100% 100% 100% 100% 100% 100% 100% Table 4: Demographics and perceived behavioural change among police officials Total Gender Age Disability Female Male Under 29 Years 30 - 49 Year Above 50 years old No Yes No 42% 45% 39% 44% 41% 42% 42% 42% Yes 56% 52% 60% 54% 58% 55% 56% 56% (blank) 2% 3% 1% 2% 1% 3% 2% 1% Grand Total 100% 100% 100% 100% 100% 100% 100% 100% The limited variation across different demographics is significant, indicating that different population groups perceive service provider corrupt behaviours in the same way. District and MDA Comparison Across the 3 MDAs the questionnaire data indicates t hat respondents see the most positive behaviour change from service providers and officials located in the provincial districts; but far less so in Western Area.
10. Table 8: Demographics and increased likelihood of saying NO to bribery to Police Total Gender Age Disability Female Male Under 29 Years 30 - 49 Year Above 50 years old No Yes No 26% 27% 25% 29% 25% 25% 26% 26% Yes 72% 70% 74% 69% 74% 73% 72% 73% (blank) 2% 3% 1% 2% 1% 2% 2% 1% Grand Total 100% 100% 100% 100% 100% 100% 100% 100% Perception of the likelihood of ACC acting against corruption 80% of respondents perceive the ACC to be more likely to act against corruption compared to one year ago. While strong political statements on corruption by the time of the questionnaire adminis tration may have influenced public perception, extensive outreach and communications work by the PNB campaign is most likely to have contributed to greater public awareness of the ACCs activities. The majority of positive responses came from Bo District where 92% stated the view that the ACC is more likely to act against corruption, compared to 63% in Western Area Rural. Respondent demography does not suggest sign ificant difference to the perceived likelihood of the ACC acting against corruption. Table 9: Demographics and perceived likelihood of ACC acting against corruption Total Gender Age Disability Female Male Under 29 Years 30 - 49 Year Above 50 years old No Yes No 19% 18% 20% 20% 19% 17% 19% 18% Yes 80% 80% 79% 79% 80% 81% 80% 81% (blank) 1% 1% 1% 1% 1% 2% 1% 1% Grand Total 100% 100% 100% 100% 100% 100% 100% 100% Chart 13: People who think ACC is more likely to act ag ainst corruption than a year ago