9. 9 Sierra Leone P olice Similar to the initial progress assessment, r espondents in th is second assessment perceived less positive change and increased negative behaviour among police officials compared to other sector providers. Still, th is assessment illustrates positive trends; police officials ceasing the practise of bribe taking has risen from 6% to 13% wi th negative change reduced from 9% to 4%. In both assessments a significant proportion (45%) report no change in behaviour. In line with health and education, respondents in PNB Core areas perceive more positive change in police officials behaviour than in the Hub and Spoke and Radio Only Areas; the core area s record higher response level s on all positive indicators and a lower percentage of people responding they had no t seen any behaviour change. C hart 15 : Perceived behaviour change by police officials C hart 16 : Perceived behaviour change by police officials in PNB Core areas C hart 17 : Perceived behaviour change by police officials in Hub and Spoke areas
8. 8 Following the same pattern as health, the respondents in the PNB Core areas saw more positive change in education providers’ behaviour than in the Hub and Spoke and Radio Only Areas. 43% in Core Areas responded that education providers had stopped asking for bribes, while only 34% in Hub and Spoke and 32% in Radio only areas. Likewise did more people not see any change in the Radio only area (26%), while it was significantly less in the C ore areas (18%). However, both Core Areas, Hub and Spoke and Radio Only areas showed a marked improvement. Kenema District indicated the most positive respons e to a change in behav iour by education providers. 51 % of respondents have indicated a c essation in payment requests; 31% report reduced frequency; 12 % that less money is requested. In the first assessment on 15/ 16 May 2018 Western Area and Kenema indicate the least change with 44% of respondents in Western Area stating that no change has occurred, 39% in Kenema. In th is second assessment it was reduced to 25% in Western area and 11% in Kenema, a significant improvement. The district recording the least positive change was Western Area Rural , where 26% responded that education officials had stopped asking for bribes ; 5% that they asked for bribes more frequently or for more money ; and 29% stat ing that they did not see any change. Chart 11: P erceived behaviour change by education officials C hart 12 : Perceived behaviour change by education officials in PNB Core areas C hart 13 : Perceived behaviour change by education officials in Hub and Spoke areas C hart 14 : Perceived behaviour change by education officials in Radio only areas
12. 12 The conclusion of the May assessment report that “ MDA engagement in the PNB Campaign is more effective in the Provinces “ contin ues to be valid. The reason put forward is that PNB engage s with district s ervice providers through monthly Regional Technical Working Group and Accountability Forums . These have strengthen ed transparency and accountability processes close to the point of service delivery. In contrast, Western Area engagement with the MDA HQ s focus more on programmatic issues with greate r distance from the service delivery . This being said, whilst has been an improvement to the public perception of Western Area service providers, this is not as pronounced as in the provinces. C hart 19 : Perceived behaviour change by health officials in the Provinces C hart 20 : Perceived behaviour change by health officials in Western Area C hart 21 : Perceived behaviour change by educations officials in the Provinces C hart 22 : Perceived behaviour change by education officials in Western Area C hart 23 : Perceived behaviour change by police officials in the Provinces C hart 24 : Perceived behaviour change by police officials in Western Area
7. 7 Whilst 27% in cores area had seen no change at all, it was 29% in Hub and Spokes areas, increasing to 38% in the area only reached by Radio. The data did not show any overall significant variances between Rural, P eri - Urban and Urban communities. H ence , the reported improvement in the Core areas does not relate the community type. The responses in Bombali, Bo and Kono had little variance and scored between 29 - 35% who indicated that health officials had stopped aski ng for bribe. Western Area and Kenema scored the least perceived positive change in behaviour, which corresponds to the findings of the last assessment. L ocal varianc es occurred – most significant being in the Urban Community in Kenema were only 12% experienced Heath officials “stopping asking for bribes” – significantly lower than u rban areas in all other district , which all scored more than 20%. Through e nga gement s with the ACC in Kenema and the IMC of Government H ospital in Kenema, the PNB was info rmed that the IMC for health in Kenema was not been functioning lately and that the Kenema Government Hospitals is having significant challenges with shortage of supplies. Education Respondent perceptions of behaviour change among education providers sho wed significant improvement from the first assessment to the second; in the first 20% responded that Education officials had stopped asking for bribes, rising to 40% in the second assessment, 30% did not see any change in behaviour, while it in the second assessment only was 19%. The data highlights a remarkable shift, which best can be explained by the introduction of the free education scheme that has changed the dynamics between the education providers and the public. As a result the perceived behaviour change by education officials is greater than for Health and Police. Chart 8: P erceived behaviour change by health officials in PNB Core areas Chart 9: P erceived behaviour change by health officials in Hub and Spoke areas Chart 10: P erceived behaviour change by health officials in Radio only areas
4. 4 Demographics The questionnaire was administered in both urban, rural and peri - urban communities (less dense populations located at the fringes of urban settlements with productive land). T he second assessment had a greater proportion of responses from rural areas (37 %) than the first (17%). This is due to the more specified sampling where responses was dedicated to “Limited outreach areas” and “Radio only areas”. Thus the data collected in the second assessment is more aligned to the demographics of Sierra Leone 3 . Di saggregation by type of locality varied by District. In Wester n Area Urban 94 % of responses was collected in the Urban Community; unsurprisingly, considering that it includes the capital of Sierra Leone. Bombali, Kenema and Kono cover ed a greater mix of communities, with Kono and Western Area Rural having a higher distribution of responses from Rural Areas. The CSO enumerators were asked to aim for a 50/50 gender distribution plus equal age distributions. Gender balance was almost achieved across age groups; age distribution closely reflected PNB data collated on the reporting platform. PWD were also interviewed, although not proportionately. 3 The 2015 Population and Housing Census showed that 41% of the Sierra Leonean population lives in Urban area (page 30) https://www.sta tistics.sl/images/StatisticsSL/Documents/final - results_ - 2015_population_and_housing_census.pdf Chart 1: Responses in types of Community Chart 2: Responses in types of Community by Distr ict
29. 29 Conclusions The August Progress Assessment confirms most of the conclusions of the May Progress Assessment, primarily: The public perception of service provider behaviour is improving, as the vast majority continues to see positive behaviour change in the 3 MDA and in all 5 districts. The progress assessment suggest s h igher levels of perceived positive behavioural change in the Provinces, as compared to Western Area. While it is levelling out in comparing to the May Progress Assessment , it is still significant and suggest that the more intensive local level engagement i n the Provinces continues to yield better results that MDA engagement with the national headquarters in Freetown. Hardly any demographic variance in terms of people’s perception of bribery; it does not appear to be influenced by gender, age or disabilit y. The conclusions reflect the broadening of the outreach of PNB , which appears to underpin a growing confidence on among citizens that ‘something will be done’ about corruption . In addition, the re are indications of improvements in responsiveness on the part of MDAs, which is particularly marked in the case of Education Ministry where 40% of respondents claimed that they had seen a change in behaviour of Education officials compared with 19% in August. This significant change coincides with the Government ’ s implementation of the Free Quality Education programme, which more closely regulates the schools’ ability to collect revenue from parents and community. The third assessment in November, will suggest whether the actual implementation lives up to the exp ectations of citizens . The findings shows linkages between the different elements of the change model in fighting corruption . These however, are not as strong as could be expected. Where citizens have received intensive outreach , their knowledge of PNB an d the information they have about Service Charters is stronger , and the more they are more aware of what MDAs should or should not be doing. They are better able to iden tify behaviour changes by service providers and more likely to be able to identify any actions taken by a particular MDA in response to reports . They are also more likely to know how to report a bribe. MDAs in areas where citizens are more engaged are likewise mor e actively engaged in the PNB : this is more likely to happen in the districts outside of Freetown as the ACC in these districts easily can engage with the MDAs and statutory authorities , and these are directly managing service delivery and can take swift localised actions.
13. 13 The most significant change between the May and August prog ress assessments is the marked improvement to public perception s of the behaviour of Education officials. This coincides with the implementation of the Free Education Programme of GoSL. However, it is worth noti ng that the interviews were conducted in the early stage of the Free Education Programme, hence the responses might reflect anticipation just as much as experience. The third progress assessment report, in November, will provide further insight . The Ministry of Basic Education continues to have limi ted national level engagement, but is part of MDA engagement in the districts. A comparison of Ch art s 21 and 22 above indicates a marked difference between Western Area and the Provinces in the public perception of behaviour change by education providers . The least positive change in service provider behaviour is see n within the Police, as also highlighted in the May progress assessment . SLP continues to be the most actively engaged MDA – at HQ level – from the three MDAs studied . This data from the SLP and the Ministry of Basic Education suggests, that MDA engagement at HQ level (like SLP) does not have as strong impact on people’s perception of the MDA , as local MDA engagement and commitment (Ministry of Basic Education). The resistance to change withi n SLP is possibly a result of a Force code, where internal loyalty is paramount. This is an issue with respect to transparency and accountability, essential qualities in address ing issues of corruption and bribery. Resistance to bribery Across the 3 sectors, 7 4% of respondents state they are more likely to say NO to pay a bribe to a pu blic official than one year ago ; a reduction from 77% in May. Education declined from 82% to 80%, Health from 77% to 73% and Police from 72% to 69%. The declines are mai nly due to large number of respondents not answering the question leaving it blank ; the percentage of people who continue to pay a bribe also declined. Table 8 : Are you more likely to say NO to pay a bribe now than one year ago? Health Education Police No 435 19% 287 12% 524 23% Yes 1696 73% 1844 80% 1596 69% (blank) 181 8% 181 8% 192 8% Grand Total 2312 100% 2312 100% 2312 100% Significant variation between districts is not evident, although data from Western Area suggests slightly less public willingness to resist bribery – just as in the May assessment . This corresponds to other questionnaire data on behaviour change by public officials that indicat es consistent ly low scoring in Western Area. T he level of outreach by the PNB Campaign appear s to have limited effect on whether the public’s is more likely to refuse paying bribes within the 3 sectors. change in likelihood of saying NO to pay a bribe, within the 3 sectors.
24. 24 The data on public perception of service provider behaviour change shows a relation between perceived positive behaviour ch anges and the outreach intensity (PNB - Core, Non - core and Radio only). The data in Chart 47, however, does not any relation between the outreach intensity and respondents abilit y to mention actions taken by the MDAs. Since the CSO animators were supposed to share stories of MDA Actions in PNB Core areas, i t would be reasonabl e to assume, that respondent are more likely to be able to mention MDA actions in these areas. correlation between the whether the public perceived positive changes in behaviour by servi ce providers in the last 3 months and whether they could mention an action taken by the MDAs within the last 3 months. The charts below show a/ perceived change of public official behaviour f rom the full data set (left) and b/ those respond ing that they could mention an action taken by the particular MDA (right) . The data indicates that respondents, who can mention an action taken by an MDA, are more likely to perceive positive changes in the MDA official’s behaviour. C hart 48 : Number of respondent who could mention an action taken per district C hart 49 : Perceived ch ange in behaviour among Education providers C hart 50 : Perceived change in behaviour among Education providers – filtered by respondents who could mention an action taken by Education
23. 23 The majority of respondents (82%) who have listened to or read about anti - corruption issue s have also discussed it with their friends and family. Similarly , 64% of the people who had not heard or read about anti - corruption , ha ve not discussed these issues with friends or family within the last 3 months. MDA Action s W ithin the Education sector 55% of respondents are able to mention an action taken by the authorities to stop bribery , which they noticed with in the previous 3 months . In the heath sector 35% mention an action taken by the MDA s , f or the SLP it is 29% of respondents. 21% of respondents are unable to mention an action taken by any MDA. This data is consistent with findings f rom previous sections on perceived behaviour change among service providers . T he public consistently report the most positive change among education providers, followed by health with police trailing behind. The data d oes not indicate a clear relation ship between the level of outreach and respondents ’ ability to describe MDA action s within the previous 3 months . In general, respondents in Kenema were able to mention the most actions taken , followed by Bo, Kono, Western Area (Urban and Rural) and Bombal i. C hart 45 : Number of respondent who has discussed anti - corruption issues by respondent who had listened to or read information about anti - corruption C hart 46 : Number of respondent who could mention an action taken by MDAs C hart 47 : Percentage of respondent who could mention an action taken by MDAs by PNB outreach level
5. 5 16% of respondents were recorded as having a disability, a figure significantly higher than the official statistic of 1.3% for Sierra Leone 4 . This discrepancy was due to the CSO Animators being asked to include persons with disabili ty in the data collection. Western Area Rural recorded a higher percentage of PWD; 25 % of respondents having a disability. Little demographic variance was noted between districts; neither in “type of Community” 5 , gender or age. 4 “ Sierra Leone 2015 Population and Housing Census - Thematic Report on DISABILITY” https://sierraleone.unfpa.org/sites/default/files/pub - pdf/Disability%20Report.pdf page 11) 5 With the exception of the Urban Community in Bombali District whi ch recorded 30% PWDs, which is significantly higher than the average of 16% Chart 5: Respondents with disabilities Chart 6 : Respondents with disabilities per district C hart 3: Responses by gender C hart 4: Responses by age group
6. 6 Perceived behavioural change among Public Service Delivery Officials Respondents were asked whether they had noted behaviour change among public service delivery providers in the last 3 months within the Health, Education and Police sectors 6 . If they had perceived a change, they were asked to identify what kind of change, and offered a multiple choice listing with the opportunity to select more than one option. Hence, in the following charts perceived changes ( green and red bars) and the No c hange should be seen as separate figures totalling more than 100%. The percentage calculation of both the perceived change (green and red bars) and the No change is based on the total number of responses made by individual respondents. Health 71 % of respondents have experienced behaviour change among hea lth providers within the last 3 months, while 29 % had not. For the first assessment 69% responded to have seen changes recently. The most commonly perceived change is that service providers are now demanding bribes less often (27%), closely followed by being more secre tive when requesting a bribe (26 %) and having stopped demanding bribes (26 %). Particularly the latter shows a significant improvement from the first assessment; 17% experienced health officials stopping asking for bribes in the first assessment while it had increased to 26% in the second. Only 2% state that that health providers now request higher payments/bribes or request them more frequently than previously, which also is an improvement from 4% in the first assessment. Citizens interviewed in the “Core PNB areas” – where the PNB outreach has been extensive and the CSOs/ACC h as been engaging – expressed having experienced mo re positive change in behaviour that the Hub - and - Spoke areas and the areas only reached by Radio. In the “Core” area 29% responded that health officials had stopped asking as for bribes , while 20% in Hub an d Spoke areas and 16% in Radio Only areas. 6 In the first Progress Assessment respondent was asked if they had experienced behaviour change recently , hence the data collection is slightly different but still comparable. Chart 7: P erceived behaviour change by health officials
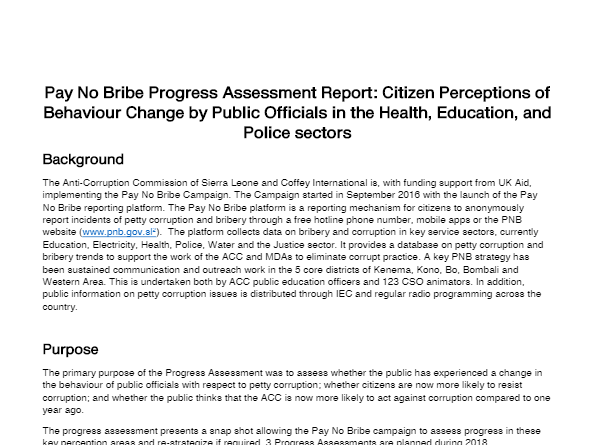
2. 2 Background The Anti - Corruption Commission of Sierra Leone and Coffey International is, with funding support from UK Aid, implementing the Pay No Bribe Campaign. The Campaign started in September 2016 with the launch of the Pay No Bribe reporting platform. The Pay No Bribe platform is a reporting mechanism for citizens to anonymously report incidents of petty corruption and bribery through a free hotline phone number, mobile apps or the PNB website ( www.pnb.gov.sl 2 ). The platform collects data on bribery and corruption in key service sectors, currently Education, Electricity, Health, Police, Water and the Justice sector. It provides a database on petty corruption and bribery trends to support the work of the ACC and MDAs to elimin ate corrupt practice. A key PNB strategy has been sustained communication and outreach work in the 5 core districts of Kenema, Kono, Bo, Bombali and Western Area. This is undertaken both by ACC public education officers and 123 CSO animators. In addition, public information on petty corruption issues is distributed through IEC and regular radio programming across the country. Purpose The primary purpose of the Progress Assessment was to assess whether the public has experienced a change in the behaviour of public officials with respect to petty corruption; whether citizens are now more likely to resist corruption; and whether the public thinks that the ACC is now more likely to act against corruption compared to one year ago. The progress assessment presen ts a snap shot allowing the Pay No Bribe campaign to assess progress in these key perception areas and re - strategize if required. This is the 2 nd of 3 Progress Assessments planned during 2018. In addition to perception of behaviour change, this second surv ey also considers level of outreach carried out by the PNB as a variable, and includes sections on Reporting Methods and Knowledge of Fees and Services, including the source of the information. Methodology The second Progress Assessment was undertaken on the 8 th /9 th /10 th September 2018 across all 5 core districts - Bo, Bombali, Kenema, Kono, Western Area (Urban and Rural). The questionnaire for the second assessment covered the same areas of the initial progress assessment , undertaken on 15/16 May 2018 . A dditional questions were added to the original questionnaire to obtain more detailed information on progress made in programme implementation in addition to exploring behavioural perception s . Furthermore, the coverage of targeted areas was specified and e xtended to cover “Core - PNB areas”, “Limited outreach areas” and “Areas only reached by Radio”. The questionnaire was administered by 75 enumerators (15 in each of the 5 core districts) using Kobo Collect . The enumerators received a refresher guide on adm inistering the questionnaire using the Kobo Collect tool on smart phones ; this support ed the 1 day training received prior to the initial assessment . Each enumerator was designated to specific area s identified in the sampling process and requested to colle ct the following : - 15 responses in a “Core - PNB area” on D ay 1 - 10 responses in a “Limited outreach area ” on D ay 2 - 5 responses in an “Area only reached by Radio” on Day 3. 15 animators x 5 districts x (15 Core - PNB area responses + 10 Limited outreach area responses + 5 Only Radio outreach area responses ) = 2250 Responses 1 The PNB website is scheduled to integrate with the Anti - Corrupti on Commission website ( www.anticorruption.gov.sl ) and will cease to exist as an individual website.
21. 21 Table 16 : Demographics and perceived risks of reporting to the ACC Gender Age Disability Grand Total Female Male Under 29 Years 30 - 49 Year Above 50 years old No Yes Reporting may not be anonymous 47% 45% 48% 47% 46% 49% 47% 50% The authorities may cause problems for me 28% 29% 27% 30% 27% 26% 28% 25% The authorities may cause problems for my family 17% 17% 17% 15% 18% 18% 16% 15% I may not get services after complaining 28% 30% 27% 28% 28% 29% 28% 30% Do not want to answer/do not know 17% 18% 16% 17% 18% 16% 17% 15% C hart 41 : Perceived risks of reporting to the ACC by PNB outreach level
18. 18 Usefulness of reporting mechanisms 99 . 95% of respondents who kn o w of the 515 line conside r it useful ; just 2 . 6% of respondents reported that n o reporting methods are useful. The data also suggests that m ore respondents fou nd the PNB mobile application useful than the actual number claiming to know about it . This suggest perhaps that citizens r espon s e s were not based on their experience, but on their belief / anticipation. T he data therefore should be viewed with that proviso in mind. The level of perceived usefulness across districts, follow s the same pattern as the “knowledge of me thods” ( chart 31 ). Bombali and Kenema display the highest score for the 515 line ; Kenema for PNB apps ; and Bo for reporting at the ACC of fice. R esponses with respect to the usefulness of reporting mechanism s clearly correlat es to the intensity of outreach in the area of the interview – with the highest perceived usefulness in PNB Core Areas, slightly reduced in Hub and Spoke areas and least in Radio only areas. In line with other indicators; gender, age and disability status ha s no significant relevance to the perceived usefulness of different ways of reporting. Table 14 : Demographics and perceived usefulness of methods of reporting to the ACC Gender Age Disability Grand Total Female Male Under 29 Years 30 - 49 Year Above 50 years old No Yes 515 87% 86% 87% 87% 86% 86% 86% 87% PNB apps 34% 33% 35% 36% 34% 31% 34% 31% Website 3% 3% 4% 3% 4% 3% 3% 2% Office 21% 21% 22% 21% 22% 20% 21% 20% None 3% 3% 2% 3% 3% 2% 2% 5% Safety of reporting mechanisms 82 % of all respondents and 90% of respondents with knowledge of the 515 hotline conside r it safe to use. Surprisingly , the number of respondent s who consider the PNB app safe exceeded the number of respondent with knowledge of it the app or who considered it useful. This suggest that peopl e respond based o n belief and not experience. Only 15% of all respondents consider it safe to report corruption to the ACC Office ; just 43% of those with knowledge of the option consider it safe. A main factor in the responses to the 515 line and reporting at the ACC office is t he anonymity of the reporter, which in both cases is a concern to the ACC ; particularly that a majority of respondents d o not consider it safe to report directly to ACC offices. C hart 34 : Perceived usefulness of reporting methods C hart 35 : Perceived usefulness of reporting methods by PNB outreach level
17. 17 Perception of method of reporting to the ACC Overall, 91% of respondents ha ve knowledge of the 515 hotline, 30% of PNB mobile app, 7% of the ACC/PNB website , 34% that it is possible to report corruption at the ACC office. V ariance between district s is very limited ; Bombali has the highest awareness of the 515 line, Kenema the PNB Mobile App , and Bo /Western Area ( Rural+Urban ) of reporting to the ACC Office. R espondents’ interviewed in Urban , Peri - urban and Rural communities had more or less identical knowledge levels of the 515 hotline ; with variance in knowledge levels of reporting using the PNB mobile application and website s . The level of outreach on the other hand provides a clearer picture , with higher knowledge levels of the 515 hotline, mobile app and website in PNB Core areas compared to the Hub and Spoke/Radio o n ly areas. There is insignificant variance by gender, ag e, and disability . Ta ble 13 : Demographics and knowledge of methods of reporting to the ACC Gender Age Disability Total Female Male Under 29 Years 30 - 49 Year Above 50 years old No Yes 515 91% 90% 92% 92% 91% 89% 91% 92% PNB apps 30% 30% 31% 32% 30% 29% 30% 29% Website 7% 6% 8% 7% 7% 7% 7% 8% ACC Office 34% 33% 34% 34% 32% 37% 34% 33% Chart 30: Knowledge of reporting methods to the ACC C hart 31 : Knowledge of reporting methods to the ACC per district C hart 32 : Knowledge of reporting methods to the ACC by Community type C hart 33 : Knowledge of reporting methods to the ACC by PNB outreach level
20. 20 ACC office 15% 15% 14% 13% 15% 16% 15% 12% None of the above 3% 4% 2% 3% 3% 4% 3% 5% Perceived risk of reporting The most commonly perceived risk of reporting to the ACC, is that it may not be anonymous . 47% of respondents ha ve this concern ; 28% perceive they could experience problems from the authorities they complained a bout or , t hat they might not receive services after complaining. Disaggregated by district, 69% of Kenema District respondents are concerned that reporting may not be anonymous. R espondent concerns regarding anonymity do not clear ly correlate to the level o f outreach; PNB Core districts ha ve the highest percentage (49%) of respondent s concerned about anonym ity . This matter has been discussed within the PNB programme and actions taken. Anxiet y about non - anonymity reflect s deep levels of distrust within the Sierra Leone population around the integrity of government and publi c bodies; Distrust is entrenched and hard to break down without a significant improvement to government and MDA transparen cy and account ability regarding actions (or otherwise) taken by them in response to public reports of petty corruption. C hart 39 : Perceived risks of reporting to the ACC C hart 40 : Perceived risks of reporting to the ACC per district
1. 1 Second Pay No Bribe Progress Assessment Report: Citizen Perceptions of Behaviour Change by Public Officials in the Hea lth, Education, and Police sectors Summary This is the 2 nd of 3 Progress Assessments aimed toward informing the PNB Campaign on progress in outcomes and implementation. This August Progress Assessment confirms the conclusions of the May Progress Assessment, primarily: The public perception of service provider behaviour is improving The progress assessment suggest s higher levels of perceived positive behavioural change in the Provinces, as compared to Western Ar ea. While it is levelling out in comparing to the May Progress Assessment, it is still significant and suggest that the more intensive local level engagement in the Provinces continues to yield better results that MDA engagement with the national headquart ers in Freetown. Hardly any demographic variance in terms of people’s perception of bribery; it does not appear to be influenced by gender, age or disability. Notably, public perception of behaviour change of Education Officials improved significantly f rom May to August, which can be explained by the expectations relating to the Free Quality Education Programme. How the perception changes with the actual implementation of FQE will be seen in the third Progress Assessment scheduled for November 2018. The findings shows linkages between PNB implementation and public perception . These however, are not as strong as could be expected. Where citizens have received intensive outreach, their knowledge of PNB and the information they have about Service Charters is stronger, and the more they are more aware of what MDAs should or should not be doing. They are better able to identify behaviour changes by service providers and more likely to be able to identify any actions taken by a particul ar MDA in response to reports. They are also more likely to know how to report a bribe. MDAs in areas where citizens are more engaged will come under increased pressure to change practices from more engaged citizens: this is more likely to happen in the d istricts outside of Freetown as the MDAs are more actively engaged the pro vinces.
19. 19 Respondents in PNB Core areas appear significantly more inclined to view the 515 line as safe (86%) in comparison with reporting to the ACC office, which 14% of PNB Core area respondents who believe it is safe to . Radio only areas record the highest percentage (8%) of respondent s stating a perception that none of the reporting methods a re safe. The perceived sa fety of reporting follow s the pattern of responses to “ knowledge of means of reporting and their perceived usefulness ” (chart 30 - 37) but with greater variance. The perceived safety of the reporting mechanisms had district variances; Bo District, which record ed the highest number of respondents with knowledge of reporting to the ACC office, also had the highest percentage ( 30% ) of the total number of respondents considered it safe to report to the ACC office. In comparison, only 6% of the respondents in Western Area Urban and Kono considered it safe to report to the ACC Office . Table 15 : Demographics and perceived safety of methods of reporting to the ACC Gender Age Disability Values Grand Total Female Male Under 29 Years 30 - 49 Year Above 50 years old No Yes 515 82% 82% 83% 81% 83% 81% 82% 82% PNB Apps 35% 34% 37% 39% 34% 30% 35% 32% Website 4% 3% 4% 3% 5% 3% 3% 3% C hart 36 : Perceived safeness of reporting methods C hart 37 : Perceived safeness of reporting methods by PNB outreach level C hart 38 : Perceived safeness of reporting methods per district
3. 3 The actual number of responses however, as Table 1 illustrates, was marginally higher than planned in all Districts. This is probably due to enumerators inadvertently collecting more responses than planned ; also the case for the initial assessment . Th e actual number of responses from this second assessment was 2312, compared to 2359 in the first . Table 1: Number of Responses collected per District Bo Bombali Kenema Kono Western Area Rural Western Area Urban Grand Total Planned Number of Responses 450 450 450 450 450 2250 Actual number of Responses 452 471 472 460 156 301 2312 In terms of sampling, the enumerators attended a briefing session with CSO Coordinators with each enumerator receiv ing the following instruction on WhatsApp, in support to the extensive training they had received prior to the first assessment in May : Sampling “ Please carry out 30 surveys in total. 15 from the core PNB location, 10 limited outreach location and 5 from the “Radio only” location. Ask every 5 th person you meet to collect a response from them. Every time you have conducted an interview, make sure to move some distance, so you do n ot interview people who are part of the same group. Go to different locations within the area you are carrying out the survey in. Aim toward collecting responses from 15 females and 15 male (50/50) over the 3 days Aim towards collecting 12 responses from t he youth, 12 from the middle aged and 6 from the seniors over the 3 days Aim toward collecting at 3 responses from people with disabilities over the 3 days ” During qu estionnaire administration on 8 th , 9 th and 10 th September , CSO Coordinator s monitored the process in their respective districts to ensure consistency in data collection, while Coffey staff was on call to address technical issues. Disclaimer: The main purpose of the Pay No Bribe Progress Assessme nt is to assess progress in key perception areas and re - strategize if required. The Pay No Bribe Progress Assessme nt was not carried out by an independent third party, but by implementing partners and does not claim scientific rigor. The main objective of the progr ess assessment was internal consumption, however the PNB programme would like to make the report available to the general public for transparency.
16. 16 where 63% in the initial assessment responded that the ACC is more likely to act ag ainst corruption, compared to 80 % in August assessment. Respondent s were slightly more positive in PNB Core Areas on the likelihood of ACC taking action against corruption ; however there is little variation between PNB Core, Non - Core and Radio Only . Respondent demography does not suggest significant difference to th e perceived likelihood of the ACC acting against corruption. Table 12 : Demographics and perceived likelihood of ACC acting against corruption Total Gender Age Disability Female Male Under 29 Years 30 - 49 Year Above 50 years old No Yes No 14% 15% 14% 15% 14% 13% 15% 15% Yes 85% 85% 86% 84% 85% 86% 85% 85% (blank) 0% 0% 0% 0% 0% 1% 0% 0% Grand Total 100% 100% 100% 100% 100% 100% 100% 100% C hart 29 : Perceived likelihood of ACC acting against corruption by outreach level
22. 22 PNB outreach The vast majority of respondent ( 73 %) stated that they had listened to or read information about anti - corruption within the last 3 months. Bo had the highest percentage (85%) of respondents confirming that they had heard or read about anti - corruption within the last 3 months, while Bombali had the lowest with 56%. In the areas with the most intensive PNB outreach 75% of respondent had heard or read about anti - corruption issu e s ; it dropped to 68% in Hub and Spoke areas and 67% in Radio only areas. Men are slightly more likely to listen to or read about anti - corruption issues than women. T he likelihood also increase s with ag e , with under 29 y ear olds being least likely and above 50 year old s more likely . Table 17: Demographics and Respondent who had listened to or read information about anti - corruption by PNB outreach level Gender Age Disability Grand total Female Male Under 29 Years 30 - 49 Year Above 50 years old No Yes Yes 73% 70% 76% 72% 73% 75% 73% 73% No 22% 24% 20% 22% 22% 20% 23% 20% Do not know 5% 6% 4% 6% 5% 5% 5% 8% C hart 42: Responden t who had listened to or read information about anti - corruption within the last 3 months. C hart 43 : Respondent who had listened to information about anti - corruption per district. C hart 44 : Respondent who had listened to or read information about anti - corruption by PNB outreach level
10. 10 There is little variance between the responses from U rban, Peri - Urban or Rural Communities in terms of perceived change to police behaviour. R esponses varied from district, but did not have a comprehensible pattern or relation to other variables. Kenema presents a high percentage of police demanding bribes less often (39%) and being more secretive (41%), but a low percentage of police ce asing the practise of bribe taking ( 8%) Bombali recorded both a high percentage for the police ceasing the practise of bribe tak ing (14%) AND asking for brib es more frequently or for more money (8%). Responses in Western Area indicated little change with 56% stating that No Change had occurred, however 14% of respondents reported the cessation of bribe taking by the police. General Respondent demographics (gender, age, PWDs, Community type) do not indicate significant difference in the perception of behaviour change. Similarly to the first assessment, the second assessment showed that i rrespective of age, gender and disability the percentage of respondents reporting “ no change ” to petty corruption is consistent: 29 - 31 % for Health ; 18% - 21% for Education; and 43% - 50 % for Police 7 . Table 3: Demographics and perceived behavioural change among health officials Total Gender Age Disability Female Male Under 29 Years 30 - 49 Year Above 50 years old No Yes No 29% 30% 29% 29% 29% 31% 28% 31% Yes 71% 70% 71% 71% 71% 69% 72% 69% Grand Total 100% 100% 100% 100% 100% 100% 100% 100% Table 4 : Demographics and perceived behavioural change among education officials Total Gender Age Disability Female Male Under 29 Years 30 - 49 Year Above 50 years old No Yes No 19% 19% 20% 19% 18% 21% 18% 20% Yes 81% 81% 80% 81% 82% 79% 82% 80% Grand Total 100% 100% 100% 100% 100% 100% 100% 100% Table 5 : Demographics and perceived behavioural change among police officials Total Gender Age Disability Female Male Under 29 Years 30 - 49 Year Above 50 years old No Yes No 45% 48% 43% 43% 46% 48% 44% 50% Yes 55% 52% 57% 57% 54% 52% 56% 50% Grand Total 100% 100% 100% 100% 100% 100% 100% 100% 7 I n the first assessment the numbers were: 29 - 34% for Health; 27% - 32% for Education; and 39% - 45% for Police C hart 18 : Perceived behaviour change by police officials in Radio only areas
15. 15 More likely 80% 80% 80% 79% 82% 77% 80% 82% (blank) 8% 8% 8% 8% 7% 9% 8% 7% Grand Total 100% 100% 100% 100% 100% 100% 100% 100% Table 11 : Demographics and increased likelihood of saying NO to bribery to Police Total Gender Age Disability Female Male Under 29 Years 30 - 49 Year Above 50 years old No Yes Not more likely 23% 25% 20% 22% 23% 22% 23% 24% More likely 69% 66% 72% 69% 70% 68% 69% 69% (blank) 8% 9% 8% 9% 7% 10% 9% 7% Grand Total 100% 100% 100% 100% 100% 100% 100% 100% Perception of the likelihood of ACC acting against corruption 85 % of respondents perceive the ACC to be more likely to act against corruption compared to one year ago , which is an improvement from 80% in the first assessment. While hi gh scores in the initial assessment w ere associated with strong political statements on corruption by the new government, the increase reported in the August assessment may reflect high er ACC visibility following coverage of high profile cases. The extensive outreach and communications work by the PNB campaign will also have contributed to greater public awareness of the ACC . The respondents’ perception of the ACCs likelihood of taking action against bribery improved in all districts and had a similar pattern to the data of the first assessment. The greatest improvement came from Western Area Rural, C hart 28 : Perceived likelihood of ACC acting against corruption
11. 11 This confirms the findings of the initial assessment in May indicat ing that different population groups perceive service provider corrupt behaviour in the same way. Table 6: Type of Community and perceived behavioural change among service providers Health Education Police Rural Peri - Urban Urban Rural Peri - Urban Urban Rural Peri - Urban Urban No 27% 31% 30% 20% 17% 20% 48% 43% 44% Yes 73% 69% 70% 80% 83% 80% 52% 57% 56% Grand Total 100% 100% 100% 100% 100% 100% 100% 100% 100% Respondents from different types of community also confirm a perceptional uniformity, add ing legitimacy to the data. The only variable that consistently appears to influence perception , is whether citizens reside in a PNB core area, a Hub and Spoke area , o r a Radio only area, as illustrated on page 4 - 9 of this report. Table 7: Focus of PNB outreach and perceived behaviou r change among service providers Health Education Police PNB Core areas Hub and Spoke Radio only PNB Core areas Hub and Spoke Radio only PNB Core areas Hub and Spoke Radio only No 27% 29% 38% 18% 19% 26% 43% 56% 56% Yes 73% 71% 62% 82% 81% 74% 57% 44% 44% Grand Total 100% 100% 100% 100% 100% 100% 100% 100% 100% Throughout, respondent perceived most change in service provider behaviour in PNB Core areas and least in areas only reach by radio. District and MDA Comparison One of the main findings of the first assessment was that respondents see the most positive behaviour change from service providers and officials located in the provincial districts; but far less so in Western Area. In this assessment, the divide between the provinces and the Western Area reduced, b ut remains con sistent sector by sector.
26. 26 More respondents interviewed in PNB Core areas state knowledge of fees and service s than in Non Core and Radio Only are as . In Kono District 28% of respondents state no t having specific knowledge of service fees , compared to 57% in Bombali and Bo , and 59% i n Kenema District . The relative low knowledge level indicates a need for an increased effort by the MDAs to share knowledge about correct payment for services through Service Charters etc – particularly in Kono District. Respondent locality across Urban, Peri - Urban or Rural settin g s d oes not impact the response. G ender, age and disability status d oes not generate significant variance. Table 19: Demographics and Respondent who could mention an action taken by the MDAs Gender Age Disability Grand Total Female Male Under 29 Years 30 - 49 Year Above 50 years old No Yes I know about fees for education services 42% 41% 42% 44% 41% 38% 42% 37% I know about fees for Health services 25% 27% 24% 28% 25% 23% 25% 22% I know about fees for Police services 17% 17% 17% 17% 17% 19% 17% 16% I do not have knowledge of correct fees for specific services 45% 45% 46% 43% 45% 51% 44% 53% Source of information on fees and services in education “PNB Animators” and “Radio Programmes” were the most common source of information on fees and services with the education sector. Of the respondents with knowledge 56% indicated the PNB animators as the source and 53% Radio. Only 22% of the respondents with knowledge of fees and services had gained it f rom a Service Charter, which equals 9% of the total number of respondents. C hart 55 : Number of respondents with knowledge of fees for services C hart 56 : Number of respondents with knowledge of fees for services by PNB outreach level C hart 57 : Number of respondents indicating the source of information for fees and services within Education Chart 5 8 : Respondents with knowledge indicating the source of information for fees and services within Education by outreach level
25. 25 In line with the other indicators, the gender, age and disability status did not influence the likelihood ot respondents ability to mention actions taken by MDAs. Table 18 : Demographics and Respondent who could mention an action taken by the MDAs Gender Age Disability Total Female Male Under 29 Years 30 - 49 Year Above 50 years old No Yes Yes - in the education sector 55% 54% 56% 55% 56% 52% 56% 49% Yes - in the health sector 35% 34% 36% 34% 36% 33% 34% 33% Yes - by the police 29% 27% 32% 26% 30% 34% 29% 28% No 21% 21% 20% 21% 20% 21% 20% 23% Knowledge of correct fees for service Almost half of the respondents (45%) have no knowledge of the correct fees for specific services. T hose with some knowledge indicate knowledge of Education fees and service s with the l east for SLP ; this pattern appears identical across districts. C hart 51 : Perceived change in behaviour among Health providers C hart 52 : Perceived change in behaviour among Health providers – filtered by respondents who could mention an action taken by Health C hart 53 : Perceived change in behaviour among Police officers C hart 54 : Perceived change in behaviour among Police – filtered by respondents who could mention an action taken by the Police
14. 14 The above chart illustrates a s mall variance between PNB Core areas and Hub and Spoke/Radio only areas. This is not nearly as significant however as the findings under “ Perceived behavioural change among Public Service Delivery Officials ” . These consistently indicate that public perce ption is of a more positive behaviour change among service providers in PNB Cores areas than in areas with less outreach. In terms of peoples own behaviour, th ere appears to be little variance between PNB Core , Hub and Spoke s, and Radio only areas. This suggests that increased outreach perhaps has greater influence on service pro vider behaviour than on citizens’ behaviour. Respondent demographics do not indicate significant variance (+/ - 2%) by age, gender and disability to bribery resistance, other than a s mall tendency among the over 50s to say NO to bribery. Table 9 : Demographics and increased likelihood of saying NO to bribery for Health service Total Gender Age Disability Female Male Under 29 Years 30 - 49 Year Above 50 years old No Yes Not more likely 19% 20% 18% 18% 20% 18% 19% 20% More likely 73% 72% 74% 73% 74% 73% 73% 73% (blank) 8% 8% 8% 8% 7% 9% 8% 7% Grand Total 100% 100% 100% 100% 100% 100% 100% 100% Table 10 : Demographics and increased likelihood of saying NO to bribery for Education Total Gender Age Disability Female Male Under 29 Years 30 - 49 Year Above 50 years old No Yes Not more likely 12% 13% 12% 13% 12% 13% 13% 11% C hart 26 : Change in Likelihood of saying NO to bribes for Education C hart 25 : Change in Likelihood of saying NO to bribes for Health Service C hart 27 : Change in Likelihood of saying NO to bribes to Police :
28. 28 Radio programmes 56% 54% 58% 58% 54% 57% 53% 67% PNB animator told me 72% 75% 68% 72% 70% 75% 71% 72% During PNB meeting 30% 30% 29% 33% 28% 26% 27% 27% Other 6% 7% 5% 4% 8% 5% 6% 6% Source of information on fees and services for police The same pattern of reported for the source of information repeated for information on police services; however with even a larger gap between PNB animator/Radio and the other sources of information. The data suggest that peop le with disability are more reliant on Radio as a source of information about police services, just as it was the case for health and education services. Table 22 : Demographics and Respondent with knowledge of fees for police and the source of the information Grand Total Female Male Under 29 Years 30 - 49 Year Above 50 years old No Yes Displayed at the police station or post (Service Charter) 18% 17% 18% 17% 18% 18% 17% 19% The service provider told me 21% 20% 21% 19% 24% 19% 20% 25% Radio programmes 60% 60% 59% 63% 57% 59% 57% 70% PNB animator told me 81% 81% 80% 85% 79% 78% 81% 75% During PNB meeting 34% 35% 34% 35% 36% 30% 31% 32% Other 4% 5% 3% 3% 5% 5% 5% 2% C hart 61 : Number of respondents indicating the source of information for fees and services for Police Chart 6 0 : Respondents indicating the source of information for fees and services for Police by PNB Outreach level
27. 27 Respondents in PNB Core areas were more likely to seen information on Service Charters and/or learned it from a PNB animators. In Hub and Spoke areas the most common source of information was the Service Provider, while it was Radio in the Radio only areas . The means by which respondent s have gain ed knowledge of fees and services within the education sector var ies slightly in line with respondent demographics. Th ose over 50 years and persons with disability learn more information from Radio sources. P e rson s with disability ha ve the lowest percentage of respondents informed by service providers. Table 2 0 : Demographics and Respondent with knowledge of fees for education and the source of the information Grand Total Female Male Under 29 Years 30 - 49 Year Above 50 years old No Yes Displayed at the school (Service Charter) 22% 22% 23% 23% 24% 18% 21% 28% The service provider told me 37% 39% 36% 36% 40% 34% 39% 29% Radio programmes 53% 53% 53% 53% 51% 57% 52% 55% PNB animator told me 56% 57% 55% 58% 54% 55% 57% 45% During PNB meeting 21% 23% 19% 19% 21% 24% 20% 19% Other 6% 7% 5% 6% 5% 4% 6% 3% Source of information on fees and services in health The source of information on fees and services within the health sector replicated with pattern for that of Education, which PNB animators and Radio to be the sources most identified. However, 33% of the respondents with knowledge of fees and services within the health sectors, identified Service Charters as one of their sources. This indicates that Service C harters are more common in health than in the education sector. Similar to the responses relating to the source of information on Educations, the respondent in the PNB Core areas had a much higher likelihood of getting information from Service Charters and PNB Animators than the other areas. People with disabilities ha ve a higher likelihood of responding that they received the information on fees for services through the radio (67%), than those without disabilities (53%). Table 21 : Demographics and Respondent wi th knowledge of fees for health and the source of the information Grand Total Female Male Under 29 Years 30 - 49 Year Above 50 years old No Yes Displayed at the PHU, clinic or hospital (Service Charter) 33% 33% 33% 29% 37% 32% 32% 31% The service provider told me 31% 29% 32% 27% 35% 28% 30% 36% C hart 59 : Number of respondents indicating the source of information for fees and services within Health Chart 6 0 : Respondents indicating the source of information for fees and services within Health by PNB Outreach level